Determine Your Estimated Blood Alcohol Concentration
Explore How the Drink Wheel Estimates BAC
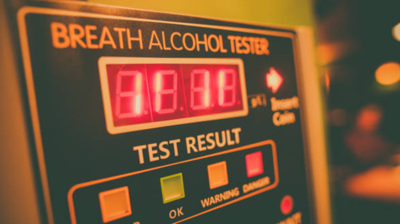
The Intoximeters Inc. "Drink Wheel" is a form that you can fill out. Upon completion they will instantly compute your estimated blood / breath alcohol concentration (BAC) based on the information that you have provided and return that estimate to you. It is presented as a public service to website visitors. Its primary purpose is to provide useful information about the responsible use of alcohol avoiding a DUI charge.
Concerned about your BAC? Call Orr Law Firm today at (303) 747-4247 or contact us online to schedule a FREE consultation.
Why Is It Called a "Drink Wheel"?
It is called a "Drink Wheel" because it is based on various paper and cardboard BAC calculators that are given out in alcohol awareness programs, some of which are in the form of a wheel that you can spin around to calculate your estimated BAC based on what and how much you have had to drink.
Disclaimer
It would be extremely foolish for anyone to pretend that the "Drink Wheel" can tell you what your BAC actually is. There are too many variables that determine your BAC and level of impairment and intoxication that cannot be taken into account in any chart or formula.
A person's actual BAC is dependent on many complex factors, including their physical condition (body composition, health, etc.) and what they have recently ingested (including food, water, medications and other drugs).
The results that are generated are rough estimates of an average healthy person's BAC assuming typical beverage sizes, recipes and alcohol content. The BAC estimates generated by the Drink Wheel should not be used to infer anyone's fitness to work, drive or perform any other task or duty.
How To Calculate Your Estimated Blood Alcohol Content (BAC)
The chart below shows an estimated percent of alcohol in the blood by number of drinks in relation to body weight.
This percent can be estimated by the following:
- Count your drinks (1 drink equals 1 ounce of 100-proof liquor, one five-ounce glass of table wine or one 12-ounce bottle of regular beer).
- Use the chart below and under number of "drinks" and opposite "body weight" find the percent of blood alcohol listed.
- Subtract from the BAC number the percent of alcohol "metabolized" during the time elapsed since your first drink. This average elimination rate of alcohol is .015% per hour. (Example: 180 lb. man - 8 drinks in 4 hours = .168% BAC minus (.015% elimination rate x 4 hrs) = .060% of the alcohol has been metabolized. Thus your BAC is .108%.
Alcohol Metabolism Chart
Source: United States Department of Transportation
| Number of Standard Drinks | Body Weight (lbs.) | ||||||||||||||||
| 100 | 110 | 120 | 130 | 140 | 150 | 160 | 170 | 180 | 190 | 200 | 210 | 220 | 230 | 240 | 250 | ||
| 1 | M | .038 | .034 | .031 | .029 | .027 | .025 | .023 | .022 | .021 | .020 | .019 | .018 | .017 | .016 | .015 | .015 |
| F | .047 | .042 | .039 | .036 | .033 | .031 | .029 | .027 | .026 | .024 | .023 | .022 | .021 | .020 | .019 | .018 | |
| 2 | M | .076 | .068 | .063 | .058 | .054 | .050 | .046 | .044 | .042 | .040 | .038 | .036 | .034 | .032 | .030 | .030 |
| F | .094 | .084 | .078 | .072 | .066 | .062 | .058 | .054 | .052 | .048 | .046 | .044 | .042 | .040 | .038 | .036 | |
| 3 | M | .114 | .102 | .094 | .087 | .081 | .075 | .069 | .066 | .063 | .060 | .057 | .054 | .051 | .048 | .045 | .045 |
| F | .141 | .126 | .117 | .108 | .099 | .093 | .087 | .081 | .078 | .072 | .069 | .066 | .063 | .060 | .057 | .054 | |
| 4 | M | .152 | .136 | .125 | .116 | .108 | .100 | .092 | .088 | .084 | .080 | .076 | .072 | .068 | .064 | .060 | .060 |
| F | .188 | .168 | .156 | .144 | .132 | .124 | .116 | .108 | .104 | .096 | .092 | .088 | .084 | .080 | .076 | .072 | |
| 5 | M | .190 | .170 | .155 | .145 | .135 | .125 | .115 | .110 | .105 | .100 | .095 | .090 | .085 | .080 | .075 | .075 |
| F | .235 | .210 | .195 | .180 | .165 | .155 | .145 | .135 | .130 | .120 | .115 | .110 | .105 | .100 | .095 | .090 | |
| 6 | M | .228 | .204 | .186 | .174 | .162 | .150 | .138 | .132 | .126 | .120 | .114 | .108 | .102 | .096 | .090 | .090 |
| F | .282 | .252 | .234 | .216 | .198 | .186 | .174 | .162 | .156 | .144 | .138 | .132 | .126 | .120 | .114 | .108 | |
| 7 | M | .266 | .238 | .217 | .203 | .189 | .175 | .161 | .154 | .147 | .140 | .133 | .126 | .119 | .112 | .105 | .105 |
| F | .329 | .294 | .273 | .252 | .231 | .217 | .203 | .189 | .182 | .168 | .161 | .154 | .147 | .140 | .133 | .126 | |
| 8 | M | .304 | .272 | .248 | .232 | .216 | .200 | .184 | .176 | .168 | .160 | .152 | .144 | .136 | .128 | .120 | .120 |
| F | .376 | .336 | .312 | .288 | .264 | .248 | .232 | .216 | .208 | .192 | .184 | .176 | .168 | .160 | .152 | .144 | |
| 9 | M | .342 | .306 | .279 | .261 | .243 | .225 | .207 | .198 | .189 | .180 | .171 | .162 | .153 | .144 | .135 | .135 |
| F | .423 | .378 | .351 | .324 | .297 | .279 | .261 | .243 | .234 | .216 | .207 | .198 | .189 | .180 | .171 | .162 | |
| 10 | M | .380 | .340 | .310 | .290 | .270 | .250 | .230 | .220 | .210 | .200 | .190 | .180 | .170 | .160 | .150 | .150 |
| F | .470 | .420 | .390 | .360 | .330 | .310 | .290 | .270 | .260 | .240 | .230 | .220 | .210 | .200 | .190 | .180 | |
| 11 | M | .418 | .374 | .341 | .320 | .297 | .275 | .253 | .242 | .231 | .220 | .209 | .198 | .187 | .176 | .172 | .172 |
| F | .517 | .462 | .429 | .396 | .363 | .341 | .319 | .297 | .286 | .264 | .253 | .242 | .231 | .220 | .209 | .198 | |
| 12 | M | .456 | .408 | .372 | .348 | .324 | .300 | .276 | .264 | .252 | .240 | .228 | .216 | .204 | .192 | .188 | .188 |
| F | .564 | .504 | .468 | .432 | .394 | .372 | .348 | .324 | .312 | .288 | .276 | .264 | .252 | .240 | .228 | .216 | |
Disclaimer:
All BAC Charts and calculators are for estimation purposes only. These are rough estimates of average BAC levels for the average person. There are many variables that determine BAC levels that cannot be taken into account in charts like these. These BAC estimates should not be used to infer anyone's ability to operate a motor vehicle.
Not sure what your BAC means for your case? Contact Orr Law Firm today to learn more!

What Sets Us Apart From The Rest?
Orr Law Firm is here to help you get the results you need with a team you can trust.
-
Offer Free Consultations and Payment Plans
-
Proven Record of Dismissals, Reductions, and Acquittals
-
Highly-Qualified Defenders Who Know How to Fight for Results
-
Award-Winning Advocacy from Top Trial Lawyers in the Nation