Denver DUI Lawyer
Our Colorado Law Firm Focuses Specifically on Drunk Driving Defense - (303) 747-4247
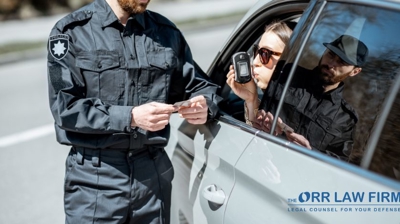
Being arrested for driving under the influence (DUI) can be a frightening experience, especially if you’ve never been in trouble with the law before. A knowledgeable Denver DUI lawyer from The Orr Law Firm can explain the legal implications of your arrest and develop an effective plan for dealing with the charges against you.
A strong defense can mean the difference between harsh penalties and a second chance. Our dedicated Denver DUI lawyer is ready to help. Schedule your consultation by calling (303) 747-4247 or reaching out online today!
What Constitutes a DUI in Colorado?
Motorists caught driving with a blood alcohol content (BAC) above .08 percent will be charged with a DUI in the state of Colorado.
In Colorado, prosecution of DUI cases is rigorous, supported by stringent laws that state zero tolerance for impaired driving. However, the state also emphasizes rehabilitation over punishment. This means that while penalties remain firm, there are multiple avenues for offenders to regain footing and rehabilitate through mandated programs.
Understanding these paths thoroughly, with the help of a professional, can significantly lessen the duration and severity of imposed restrictions. Our experienced DUI lawyers in Denver can offer insights into leveraging such rehabilitation programs.
What is the Difference Between a DUI and a DWI in Colorado?
The term DWI is used in other states, but in Colorado, the correct legal term is DUI, not DWI. However, Colorado uses other terms for drunk driving offenses depending on the level and type of impairment:
- DUI (Driving Under the Influence) – The driver is substantially incapable of safely operating a vehicle due to alcohol and/or drugs.
- DUID (Driving Under the Influence of Drugs) – Drug-specific version of DUI.
- DWAI (Driving While Ability Impaired) – A lesser offense, meaning the driver is impaired to the slightest degree.
What are the DUI Penalties in Colorado?
You will face the following penalties if convicted of a DUI:
- Incarceration: A first-time DUI conviction may involve jail time between five days and one year. Judges usually hand down more jail time if the offender has a high or aggravated BAC, was involved in an accident, or after second and subsequent offenses.
- Large fines: The fine is between $600 and $1,000 for a first-offense DUI. These fines increase to up to $1,500 for subsequent convictions. This does not include the cost of prosecution, as well as all the out-of-pocket costs associated with probation, monitored sobriety, and alcohol classes.
- License suspension: A first-offense DUI conviction may result in a one-year administrative driver’s license revocation in Colorado, potentially leaving you unable to travel to work or school. If it is your second or third offense, you could lose your license for between one and five years — a substantial amount of time to go without driving privileges.
- Mandatory IIDs: Even on a first offense, you may have to install an ignition interlock device (IID), which comes at your own expense and requires you to pass a BAC test before you can start the car and periodically while driving. Upon subsequent convictions, IID installation is typically mandatory and for longer periods of time.
Colorado’s DUI penalties extend beyond court-imposed sanctions to affect personal and professional aspects of life. Convictions often result in increased auto insurance premiums, mandatory reporting to professional boards for licensed occupations, and potential repercussions on employment, especially where a commercial driver’s license (CDL) is involved.
The external impacts of a conviction can stall career progress, restrict familial responsibilities, and deter social engagement, underscoring the importance of seeking knowledgeable legal help early in the process. Contact a Denver DUI lawyer at Orr Law Firm today to schedule your free consultation.
Is a DUI a Felony in Colorado?
In Colorado, a DUI is a Class 4 Felony if there were 3 or more previous DUI convictions. It can also be charged as a Class 4 Felony if it led to vehicular homicide or vehicular assault.
Felonies are more severe than misdemeanors and entail higher penalties including lengthier imprisonment terms, larger fines, and an indelible criminal record. Having a felony on record can have lasting impacts on one’s life, affecting future job prospects, housing opportunities, and personal freedoms.
Legal representation from a DUI attorney is crucial in exploring alternative sentencing or reduction of charges, potentially averting lifelong consequences that accompany a felony conviction.
What are Other Types of DUI-Related Offenses?
In addition to DUI, the following other types of alcohol- and controlled substance-related traffic offenses are regulated by state law and prosecuted similarly:
DWAI in Colorado
According to Colorado state law, driving while ability impaired (DWAI) occurs when you operate a vehicle after consuming alcohol or drugs — or a combination of both. These substances must result in you being unable to exercise clear judgment mentally or physically, thereby impairing your ability to drive safely to the slightest degree.
DWAI might appear to carry lighter penalties than DUI, yet its consequences on your driving record and insurance rates can be substantial. Even a minimal impairment can lead to arrests, and subsequent conviction carries implications similar to a DUI, such as points on your license and increased insurance costs.
It's crucial to address DWAI charges seriously and seek representation from a Denver DUI lawyer who understands both the immediate and long-term repercussions on your driver’s license and personal insurance premiums.
DUID in Colorado
Driving under the influence of drugs (DUID) has become a particular focus of law enforcement since 2012, when Colorado voters approved the legalization of recreational marijuana.
The type of drug doesn’t matter when it comes to DUID — if law enforcement officers deem that you’re impaired, you will be arrested and charged accordingly.
You will be required to submit to a blood test, and failure to comply will result in you being charged with a refusal and potentially losing your license for a minimum of one year.
UDD in Colorado
Underage drunk driving (UDD) involves anyone under the age of 21 operating a vehicle while under the influence of alcohol or drugs.
In accordance with the law, offenders who are not of the legal drinking age and have BACs that measure above .02 percent — the equivalent of less than one drink for many people — face charges and penalties if convicted.
What is the DUI Court Process in Colorado?
The DUI court process in Colorado is thorough, ensuring that each case is handled with careful consideration to uphold justice and public safety. After an arrest, the defendant receives a summons with the date for their first court appearance, known as the arraignment.
At this stage, the charges are formally read, and the defendant can enter a plea of guilty, not guilty, or no contest. Following the arraignment, pre-trial conferences often take place, where the defense and prosecution discuss potential plea bargains that may reduce charges or penalties.
Throughout the legal proceedings, both sides may file motions to suppress evidence or dismiss charges if procedural errors are found. If the case goes to trial, the defense must challenge the prosecution’s evidence, including test results and law enforcement testimony.
While many DUI cases are resolved through plea deals, those that proceed to trial are decided by a judge or jury. Having skilled legal representation at every stage is crucial for protecting the defendant’s rights and building a strong defense strategy.
Should You Get a Lawyer for DUI in Colorado?
Hiring a Denver DUI attorney is generally advisable when faced with a DUI charge. In Colorado, drunk driving is a severe offense that can lead to hefty fines, loss of driving privileges, and even jail time.
An experienced attorney can help you understand the criminal charges against you, explain your options, and fight for the best possible result. Our Denver DUI attorneys serve clients throughout Colorado; contact us today!
Many people are unaware that DUI arrests can also result in personal financial hardships beyond legal penalties. Having a competent attorney is crucial not only for defense but also for minimizing these impacts. A lawyer can negotiate alternative sentencing options, such as community service or attendance at educational programs, which might mitigate some of the financial burdens associated with traditional penalties.
Furthermore, engaging a lawyer early in the process increases the chances of identifying any inconsistencies or deviations in DUI testing procedures, further fortifying your stance in defending against the charges.
What to Look for in a DUI Defense Attorney?
When facing DUI charges, securing a competent defense attorney can significantly impact the outcome of your case. Here are several critical attributes to consider when selecting a DUI defense attorney:
- Experience and knowledge: A proficient DUI defense attorney should possess extensive experience in handling DUI cases. This focused knowledge allows them to navigate the complexities of DUI laws effectively. Look for an attorney with a proven track record of successful defenses, as this indicates their ability to strategize effectively and pursue favorable outcomes for their clients.
- Local knowledge: DUI laws and procedures can vary significantly by jurisdiction. An attorney familiar with the local court system, prosecutors, and judges can leverage this knowledge to your advantage. Their understanding of local nuances can help in negotiating plea deals or identifying weaknesses in the prosecution's case.
- Reputation and reviews: Researching an attorney's reputation can provide valuable insights into their reliability and effectiveness. Online reviews, client testimonials, and peer endorsements can highlight their strengths and potential weaknesses. Additionally, professional accolades and memberships in legal associations can further validate their credibility.
- Communication skills: Clear and open communication is essential in a legal defense. A good DUI attorney should be accessible, responsive, and able to explain complex legal concepts in understandable terms. This ensures you remain informed about your case's progress and can make informed decisions throughout the legal process.
- Personalized attention: Every DUI case is unique, and a one-size-fits-all approach is seldom effective. Seek an attorney who is willing to invest time in understanding the specific details of your case and tailoring their defense strategy accordingly. Personalized attention increases the likelihood of identifying unique defense opportunities that might be overlooked in a more generic approach.
What are the Benefits of Hiring a DUI Law Firm?
Hiring a criminal defense law firm in Denver, CO, can be beneficial for those looking to navigate the complexities of DUI laws. With their focused knowledge and experience, Denver DUI defense attorneys can help you understand your rights and the potential consequences of your case.
A criminal defense law firm can investigate all aspects of your DUI case, evaluate evidence, build an effective defense strategy, and provide legal advice that is tailored to your specific circumstances. Additionally, they will handle all court appearances on your behalf and negotiate with prosecutors if appropriate in order to achieve the best possible outcome.
Criminal defense attorneys can help reduce the impact of a DUI charge on your future by negotiating alternate sentences or helping you enroll in rehabilitation programs if necessary. This may include an alcohol education class, driver improvement courses, or even community service. By taking these steps with the assistance of a professional, you have a greater chance of avoiding severe penalties such as jail time or high fines from the court system.
You May Only Have 7 Days To Defend Your Driving Privileges - Act Now!
With the potential penalties in mind, you can understand why it’s critically important to work with a trustworthy DUI lawyer to fight the charges against you.
At The Orr Law Firm, our Colorado DUI lawyers have the skill and experience you need to ensure you receive the best possible outcome given the facts of your case.
We use effective defense strategies to:
- Minimize jail time
- Avoid hefty fines
- Preserve your driving privileges
Experienced and well-trained, we keep you informed at every step in your case and help you explore all of your legal options. Call us today at (303) 747-4247 or contact us online for a free case evaluation.
FAQ About DUI Defense in Denver
What Are the Steps Following a DUI Arrest in Denver?
After a DUI arrest in Denver, it is crucial to act swiftly and strategically. The first step is to contact a skilled DUI attorney who understands the local legal system and can provide immediate guidance. Within seven days of your arrest, you must request a Department of Motor Vehicles (DMV) hearing to contest your license suspension. This hearing is separate from your criminal case, and missing this deadline can result in automatic suspension of driving privileges.
Your legal representative will begin by collecting all the evidence relevant to your case, reviewing police reports, examining witness statements, and scrutinizing the results of sobriety tests to identify any inconsistencies or rights violations. It is also common to conduct an independent investigation, possibly involving experts in fields like forensic toxicology to challenge the prosecution’s evidence. Throughout this process, your attorney will aim to preserve your rights, negotiate with prosecutors, and work towards dismissing charges or securing a plea deal that minimizes penalties.
How Does Colorado Handle DUI Charges Differently?
Colorado DUI laws are particularly strict, reflecting the state’s commitment to reducing impaired driving incidents. Unlike other states, Colorado employs a tiered DUI offense system, categorizing offenses based on the severity of impairment and the driver’s age or history of previous offenses. For instance, a Blood Alcohol Content (BAC) over 0.15% is deemed an aggravated DUI, which carries more severe penalties, including longer mandatory classes and extended IID use.
Another critical difference is Colorado’s express consent law, which mandates drivers to submit to chemical testing if a law enforcement officer suspects impairment. Refusal to comply with these tests can result in an immediate license suspension, adding complexity to your legal strategy. These unique aspects of Colorado DUI law necessitate representation by lawyers who are deeply familiar with state-specific regulations and procedures, ensuring a well-informed defense that aligns with local legal standards.
What Are the Potential Long-Term Impacts of a DUI Conviction?
A DUI conviction extends beyond immediate penalties like fines, license suspension, and jail time, often casting a long shadow on your personal and professional life. The conviction could lead to increased insurance premiums as providers may classify you as a high-risk driver. Furthermore, it might necessitate disclosure on job applications, potentially limiting career opportunities, especially in fields requiring a clean driving record or background checks.
A conviction can also affect professional licenses, whether you're a commercial driver or work in healthcare, education, or other regulated industries. Additional consequences include complications in international travel, particularly to countries with strict entry rules against travelers with a criminal record. Understanding these far-reaching effects underscores the importance of pursuing a defense that not only addresses immediate legal challenges but also mitigates the longer-term adverse outcomes of a DUI conviction.
Is It Possible to Have a DUI Expunged in Colorado?
Expunging a DUI conviction from your record is challenging in Colorado, as state laws are quite restrictive about sealing or expunging criminal records. In most cases, offenses like DUI are not eligible for expungement unless they qualify under specific conditions, such as being overturned on appeal or being a juvenile offense under unique circumstances.
However, if your DUI charge results in an acquittal or dismissal, it may be possible to seal your record, removing the charge from public view. Given the complexity and stringent requirements of Colorado’s expungement laws, seeking the advice of a seasoned DUI lawyer is vital. They can provide insights and strategies to potentially qualify for an expungement or guide you toward alternative methods to minimize the visibility of your criminal record aligned with your specific situation.
How Do Ignition Interlock Devices Work in Colorado?
In Colorado, ignition interlock devices (IIDs) serve as a preventive measure allowing certain DUI offenders to regain driving privileges while ensuring they drive sober. These devices, installed in the offender’s vehicle at their own expense, require the driver to perform a breath test before the engine starts and at random intervals while the vehicle is in operation.
IIDs measure the driver’s BAC; if alcohol is detected above a preset limit, the device prevents the engine from starting, and records of failed tests are sent to the Department of Motor Vehicles. Offenders must regularly visit service centers to maintain and calibrate the device, ensuring it functions correctly. By adhering to the IID program, individuals can retain some independence and mobility while demonstrating compliance and commitment to safe driving practices. Legal advisors can further explain obligations associated with IID use and assist in managing compliance successfully.

What Sets Us Apart From The Rest?
Orr Law Firm is here to help you get the results you need with a team you can trust.
-
Offer Free Consultations and Payment Plans
-
Proven Record of Dismissals, Reductions, and Acquittals
-
Highly-Qualified Defenders Who Know How to Fight for Results
-
Award-Winning Advocacy from Top Trial Lawyers in the Nation